
BUSINESS
Sudeep Shah Caps Tata Stocks as Nifty Holds 23,000
Sudeep Shah keeps Tata Chemicals, TCS and TMPV below chart ceilings and names five longs while Nifty sits on the 23,000 floor.

Nifty 50 closed Friday, September 18, at 23,346.40, up 75.80 points or 0.33%, after a sixth straight weekly loss of 0.22%. The Sensex finished at 74,294.96, down 19.63 points or 0.03%, its longest weekly losing run since 2020.
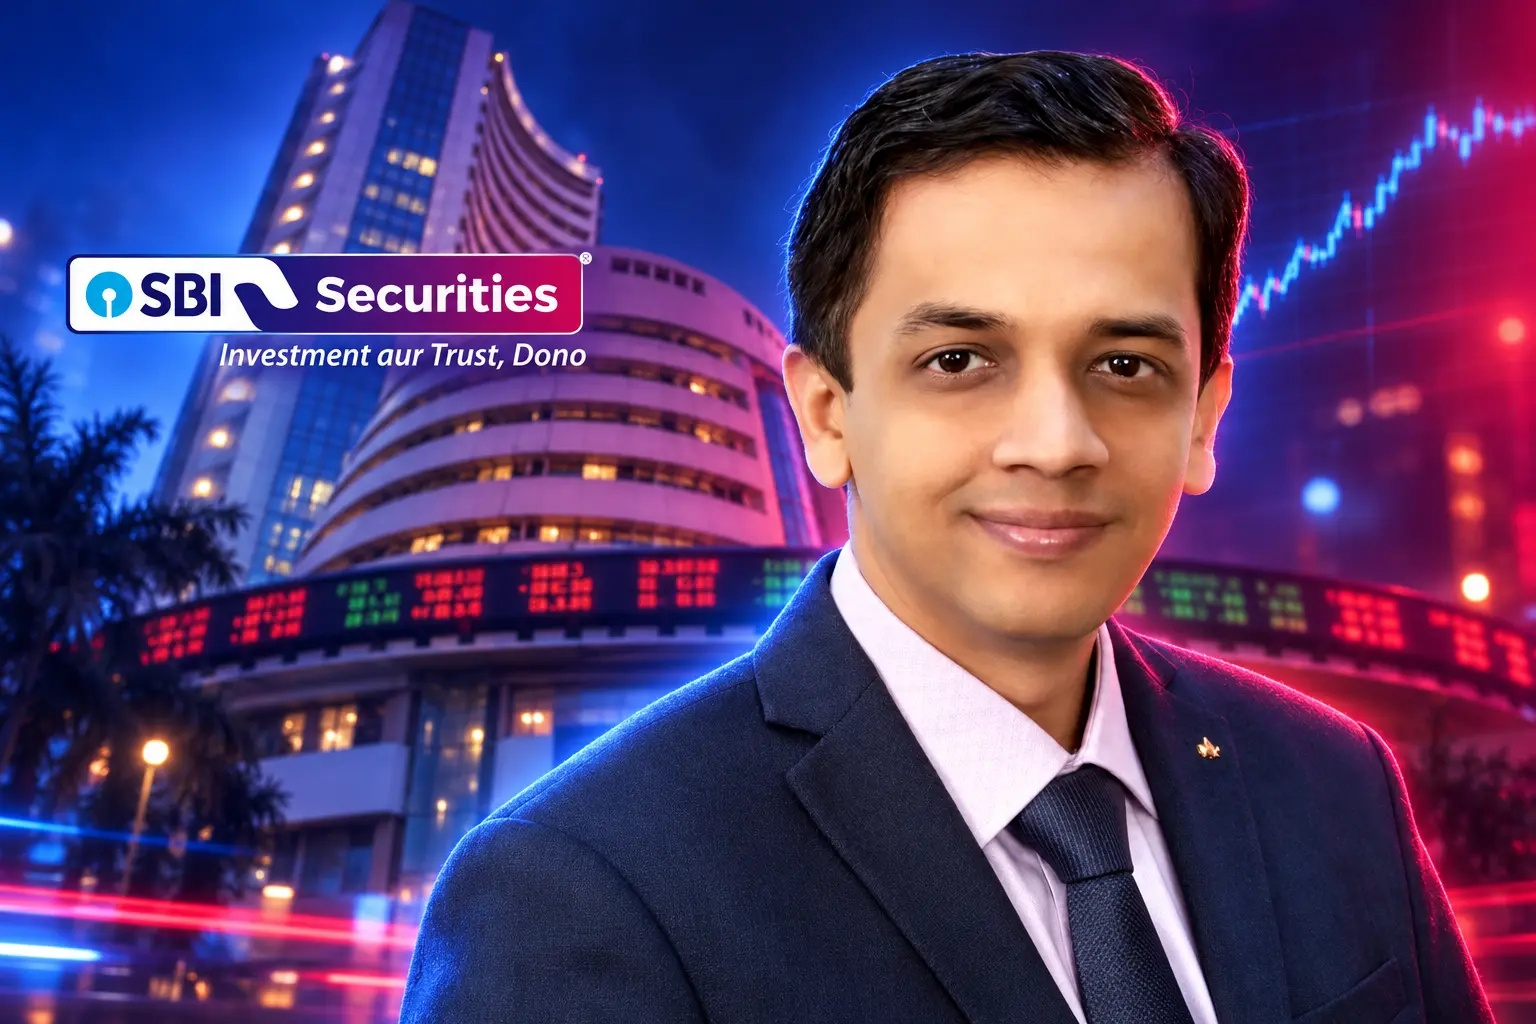
Sudeep Shah, Vice President and Head of Technical and Derivatives Research at SBI Securities, still treats 23,000 as the line that decides the next swing. Until Tata Chemicals, TCS and Tata Motors Passenger Vehicles reclaim their ceilings, he will not treat those charts as longs, and he would rather own Sona BLW, Eternal, Lumax Auto Technologies, Eicher Motors and Indian Hotels inside a 23,000-23,500 range.
The Sixth Red Week Still Has a Floor
Both benchmarks were green before the closing auction session began at 3.20 pm, then the indicative Sensex price dropped nearly 1,000 points in a few seconds before bouncing. Nifty got all of that swing back. Sensex did not. It was the third straight gain for Nifty and a second straight split close versus Sensex.
Shah said the weekly candle was still bearish, with a lower shadow that shows buyers showed up at the lows. The index remains below its short-term and long-term moving averages, and those averages are still falling. Daily RSI bounced from 22.23 to 34.17 and printed a bullish crossover, which he reads as a pause in the selling rather than a trend change.
FRIDAY’S TAPE
- Nifty 50: Closed at 23,346.40, up 75.80 points, 346.40 points above 23,000 and 153.60 points below 23,500.
- Sensex: Closed at 74,294.96, down 19.63 points, and down 0.65% for the week.
- Breadth: Nifty Midcap 100 rose 1.24% and Nifty Smallcap 100 rose 1.74%.
- Flows: Foreign investors sold equities worth Rs 3,208.76 crore on Thursday, while Brent crude fell 1.35% to $103.4 a barrel.
The 23,050-23,000 band is, in his work, the overlap of a prior swing low and the 61.8% Fibonacci retracement of the last up-move. A clear break under 23,000 would, he said, reopen 22,700. Overhead, the 10-day EMA at 23,450-23,500 is the first hurdle; a hold above 23,500 would open 23,700, then 23,900.
Put Writers Built a Floor at 23,300
For the current weekly expiry on Tuesday, September 22, Shah sees heavy call supply near 23,400, then at 24,500, and the thickest put base at 23,300, then 23,200. A chain snapshot after Friday’s close puts the highest put open interest at 23,300 at 1.27 crore contracts, with 23,200 puts at 96.0 lakh. The largest call pile on that chain sits at 24,000 (1.16 crore), with 23,500 at 92.3 lakh, 23,400 at 87.7 lakh and 24,500 at 1.01 crore. Put-call ratio is 1.12. Max pain is 23,350, four points from the cash close.
NIFTY WEEKLY EXPIRY OPEN INTEREST
| Strike | Side | Open interest |
|---|---|---|
| 23,300 | Put | 1.27 crore |
| 23,200 | Put | 96.0 lakh |
| 23,400 | Call | 87.7 lakh |
| 23,500 | Call | 92.3 lakh |
| 24,000 | Call | 1.16 crore |
| 24,500 | Call | 1.01 crore |
That stack leaves very little room. Spot is already hugging max pain, puts are loaded just under the market, and calls thicken from 23,400 through 24,500. Index longs into Tuesday’s expiry are fighting writers, not a vacuum.
Ashish H. Kyal, a CMT and SEBI-registered research analyst, framed a break below 23,300 as a sell trigger on the three-candle rule heading into Monday. Other tape-readers still want two cash closes under 23,000 before they treat the floor as gone. Thursday night’s crash calls toward 23,000 and 22,800 did not print on Friday. The index rose. The damage sat in Tata names.
Tata Chemicals, TCS and TMPV Stay Capped
Shah was asked how to trade Tata Chemicals, Tata Investment Corporation, TCS and Tata Motors PV. He did not green-light any of them. Chemicals had bounced for two days and ran into its 100-week EMA at Rs 805-810. TCS is below its averages, with RSI under 40 and MACD below zero, and he puts resistance at the 20-week EMA of Rs 2,310-2,320. Tata Motors PV is in the same posture, RSI under 40 on the weekly chart, with Rs 320-325 as the first ceiling. Tata Investment has sat in a Rs 762-616 band since late April, with a flat RSI, a flat ADX and a weekly MACD still below zero.
Friday’s cash market already ran those ceilings over. Tata Trusts, the majority shareholder of Tata Sons, on September 17 called the reappointment a legal nullity after four directors voted to give N. Chandrasekaran, Chairman of Tata Sons, another five-year term and Noel N. Tata, Chairman of Tata Trusts, voted against. Tata Chemicals closed at ₹693.25, down 11.04%. TCS closed at ₹2,105, down 3.88%. TMPV closed at ₹303.80, down 3.40%, not far from its 52-week low of ₹294.30. Tata Investment closed at ₹702.35, down 2.36%, still inside Shah’s range.
SHAH’S CEILINGS VERSUS FRIDAY’S CLOSES
- Tata Chemicals: Needs a clear break above Rs 805-810; Friday’s close at ₹693.25 sits well under that band.
- TCS: Bearish bias lasts below Rs 2,310-2,320; the stock finished at ₹2,105.
- Tata Motors PV: Bearish bias lasts below Rs 320-325; the stock finished at ₹303.80.
- Tata Investment: No direction until a break of Rs 762 or Rs 616; ₹702.35 is still inside the band.
Those are not hair-trigger levels. Chemicals would need more than Rs 110 from Friday’s close just to test the 100-week EMA it already failed. TCS would need about Rs 205 to reach Shah’s first resistance. TMPV is closer, roughly Rs 16-21 under the 320-325 zone, but it is still under every average he flagged.
HOW THE TATA TAPE BROKE
- August 12, 2026: Chandrasekaran tells the Tata Sons board he will not offer himself for reappointment when his term ends on February 20, 2027.
- September 15, 2026: Tata group stocks jump after the RBI’s rejection of Tata Sons’ bid to stay unlisted puts a listing back on the table.
- September 17, 2026: The board votes 4-1 to reappoint him; Tata Trusts call the resolution void under the Articles of Association and say a legal opinion from former Chief Justice D.Y. Chandrachud was not taken on board.
- September 18, 2026: Chemicals, TCS, TMPV and Tata Investment fall, while Nifty still closes green.
Shah’s note does not trade the governance fight. It trades the moving averages. Until those four charts recapture the zones he named, the pullbacks are still, in his book, bounces inside downtrends or a range.
The Five Names on the Other Side of the Tape
Asked for five stocks that “look good on the charts” for the coming week, Shah named Sona BLW Precision Forgings, Eternal, Lumax Auto Technologies, Eicher Motors and Indian Hotels Company. He did not publish targets or stops for them. Friday’s tape still showed which side of his split was working.
FRIDAY CLOSES FOR SHAH’S FIVE
| Stock | Close (₹) | Friday change |
|---|---|---|
| Sona BLW Precision Forgings | 808.00 | +3.87% |
| Eternal | 326.85 | +1.40% |
| Lumax Auto Technologies | 2,102.70 | +4.20% |
| Eicher Motors | 7,516 | +0.30% |
| Indian Hotels Company | 732.75 | +0.84% |
Sona BLW Precision Forgings closed at ₹808, up 3.87%, after opening at ₹780.20. Lumax Auto Technologies, an auto ancillary, closed at ₹2,102.70, up 4.20%, near a 52-week high of ₹2,148.70. Eternal rose 1.40% to ₹326.85. Eicher Motors added 0.30% to ₹7,516. Indian Hotels, the Tata group hotel company, closed at ₹732.75, up 0.84%, and was one of the Tata names that finished higher while Chemicals, TCS and TMPV sold off.
That last name is the exception inside the house, not a reversal of Shah’s Tata map. He still wants Chemicals, TCS and TMPV to beat their weekly averages before he treats them as longs. The five he did name are the charts he is willing to own if Nifty only holds the 23,000-23,500 cage rather than breaking it.
IT and Bank Nifty Remain Under Key Averages
Nifty IT fell 1.03% on Friday. Shah said the sector index is below its key moving averages after failing its 100-day EMA four sessions earlier, with RSI under 40. He keeps a bearish bias while it is below 29,300-29,400. TCS was the heaviest single-stock expression of that tape, down 3.88% to ₹2,105, still about Rs 205 under his 20-week EMA cap.
Bank Nifty closed at 56,358.70, up 0.54%. That bounce does not clear Shah’s map. He has the index stuck in a 56,996-55,699 range for seven sessions, still under its key averages, with ADX rising as a sign of bearish trend strength. As long as it is below the 200-day EMA zone of 56,700-56,800, he calls the trend sideways to bearish. Friday’s close is about 340 points under that EMA band and still inside the seven-day range.
Index traders looking for a clean bank-led rescue do not have it on his levels. The 23,000-23,500 Nifty fight is happening without IT leadership and without Bank Nifty above its 200-day average.
What a Break Below 23,000 Would Open
Shah’s next clue is not a sector call. It is how Nifty behaves around 23,000. Hold that band and the short-term pause he sees in RSI can stretch toward 23,450-23,500. Lose 23,000 and he would look for 22,700. A hold above 23,500 would, in his sequence, open 23,700 and then 23,900.
With support and resistance now clearly defined, the battle between 23,000 and 23,500 could set the tone for Nifty’s next short-term move.
Sudeep Shah, Vice President and Head of Technical and Derivatives Research, SBI Securities
Monday, September 21, is the first cash session after that map, and Tuesday, September 22, is weekly expiry, with 23,300 puts and 23,400-24,500 calls still the strikes writers have to defend. The sixth down week ended with Nifty 346.40 points above 23,000 and with Tata Chemicals, TCS and TMPV still under the ceilings Shah set. The five names he did like closed green.
If 23,000 holds into expiry, the live question on his sheet is whether Sona, Lumax, Eternal, Eicher and Indian Hotels keep paying while the Tata charts he capped stay dead money. If 23,000 goes, 22,700 is the first number he has on the downside, and those same Tata ceilings get further away.
Disclaimer: This article is news reporting and technical-analysis coverage for information only. It is not investment advice, a research report, or a recommendation to buy or sell any security, index, or derivative. Readers should consult a SEBI-registered investment adviser or research analyst who knows their capital and risk limits before acting on any level or stock named here. Prices, open interest, and chart levels reflect the sources on the dates given above and can change in the next session.

A CubeSat Will Age Whisky That Never Comes Home

A Charity Quote Cost Shia LaBeouf the FKA twigs NDA

Looker Turned a Model’s Body Into Ad Inventory

Infinity Ward Bets a Paid DMZ Will Stick This Time

Disney Sidesteps a Kimmel Renewal as Failla Cites Losses

How to Get Pre Boarding on Southwest – Skip the Line with These Tricks

False AI Intel Nearly Put US Crews on a Chinese Ship

Tim Cook’s $4.6 Trillion Apple Still Runs on One Phone

Dunes Air Sues Nora Fatehi Over Its Luxury Jet

OpenAI Posts a Navier-Stokes Proof Clay Has Not Touched
-
 TRAVEL3 years ago
How to Get Pre Boarding on Southwest – Skip the Line with These Tricks
-
 NEWS1 month ago
False AI Intel Nearly Put US Crews on a Chinese Ship
-
 BUSINESS2 months ago
Tim Cook’s $4.6 Trillion Apple Still Runs on One Phone
-
 ENTERTAINMENT2 months ago
Dunes Air Sues Nora Fatehi Over Its Luxury Jet
-
 NEWS2 months ago
OpenAI Posts a Navier-Stokes Proof Clay Has Not Touched
-

 LIFESTYLE3 years ago
How Often Do You Have to Change a Monkey’s Diaper? The Truth About Pet Monkeys
-

 NEWS2 months ago
Australia Treats Cloud Software Payments as Taxable Royalties
-

 LIFESTYLE3 years ago
How Long Does It Take for Armpit Hair to Grow? The Stages of Hair Growth and How to Shave It